You are here
Propagation Maps
Propagation Maps
What is a propagation map and what is it used for? A predictive model of coverage showing signal strength at different distances from the antenna. It is not always an accurate predictor of what coverage will be. With today’s technology and services, propagation maps should show and account for each of the different frequency bands that will be used by the facility, though by requiring only the least and the most robust frequencies to be shown, that inherently accounts for those frequencies in between.
Why is it so critical to know how to analyze propagation maps? Propagation maps are the most common means of proving the technical need for what is requested, e.g. the needed height (nothing lower will work), the needed location (no other location will work) and the need for a tower (no existing structure will work).
How is a propagation map produced? By inputting variables and desired design and operating parameters into a software program.
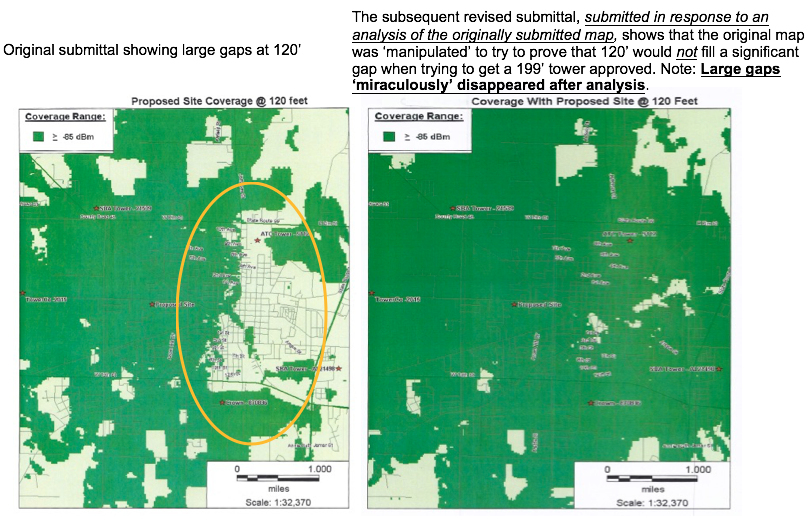
Are propagation maps able to be ‘manipulated’ to show a desired result, such as the inability of a co-located facility to work rather than building a new tower? Yes, very easily, and manipulating propagation maps is frequently done in an attempt to ‘justify’ something the applicant wants, but that is not allowed under local regulations; in other words, to ‘justify’ a waiver or relief from the local regulations.
What is a dB? A measurement of signal strength
What is dBm? Decibels per milliwatt
How are signal strengths depicted on a Propagation Map? In different colors and shades
How strong a signal is really needed? What are the minimum ‘thresholds’ of the signal strengths, generally speaking?
Measurement of RF Signal Strengths:
The measurement of RF signal strength is a logarithmic function. Every 3 dB increase doubles the previous signal strength. The lower the number the stronger the signal, e.g. -85dBm is twice as strong as -88dBm. Any stronger signal strengths are generally speaking not a technical necessity for the provision of service, but are frequently asserted by carriers as being needed. As long as the user device has a signal that is at least -106dBm the service should work just fine.
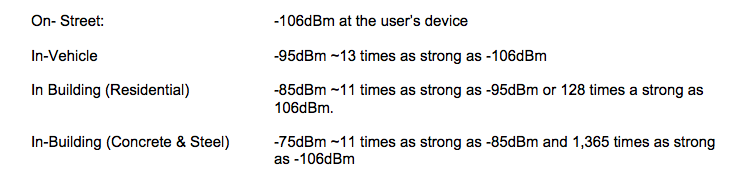
The signal outside a vehicle or building must be strong enough to allow for the signal loss created as the RF signal passes through the glass or body of a vehicle or the walls of the building. As shown by the threshold signal strengths below, to have a useable signal at the device in a building requires the signal outside the building to be ~128 times as strong as when the user is outside on the street.
Threshold signal strength levels at which most user equipment is designed to function reliably.
However, even though today the major carriers all use effectively the same basic technology, e.g. LTE, or are quickly migrating to it, some carriers argue the need for stronger signal strengths for certain frequency bands such as Advanced Wireless Service (AWS). However, the need for a stronger signal for LTE or AWS service has not been proven to be a technical need.
What is the ‘Modeling’ Information and why is it critical to have it when analyzing a propagation map?
The modeling information is all of the variables that are inputted into the software that generates the propagation map(s). It’s critical to have this, because it is relatively easy to ‘manipulate’ what the map shows by simply manipulating some of the modeling information. A simple non-technical example is the assumed ambient tree height that is used to determine how tall the facility must be.
Without the modeling information, propagation maps are not much more than pretty-colored pieces of paper. It determines virtually everything about the system design, including but not limited to location, height and the ability or inability to attach to an existing structure.
(In a community with a maximum allowable height of 120’)